In this blog, I will first talk about my motivation to understand multivariate multiple regression followed by my search process, and then my interpretation of this methodology.
Multivariate multiple regression is nothing new. We all remember the statistics courses where the last few lectures are dedicated to explaining the matrix formulation of OLS regression, its equivalence followed by the multivariate multiple regression where multiple outcome variables are simultaneously modeled.
I am working on a research problem of relating environment factors on instantaneous stress of an individual. The instantaneous stress response is measured using multiple heart rate variability (HRV) such as SDNN, RMSSD, normalized HF, normalized LF and LF/HF. I am interested in simultaneously modeling these outcomes using Frequentist as well as Bayesian approaches that account for random effects across the study parcitipants.
I went back to my statistical textbook Applied multivariate statistical analysis by Johnson and Wichern to understand the math and nuances of modeling a multivariate gaussian outcome in multivariate OLS. Due to either my ineptitude in searching or my impatience, I couldnt locate the paragraph or section where the author motivates the use of multivariate regression as opposed to several multiple regression models corresponding to each outcome variables. That is, why to develop a single model instead of multiple indepedent models for a set of outcomes. In operations research, we have multiobjective programming. In Bayesian modeling, I have heard of researchers referring to such multi-outcome scenarios as multi-task learning approaches. In econometrics and social sciences, people often consider structural equation modeling (this is different from simulatenous equation modeling which shares the same acronym). But in the frequentist approach of multivariate regression modeling, I wasn’t sure of two basic aspects.First, how is the multivariate model coefficients different from the univariate case, and second, why do we model two outcomes to get multiple set of coefficients for inputs. The difference from the other methods such as SEM or Bayesian, is that here we do not assume a latent factor or intermediate/moderating variable that is modeled by inputs and which in turn affects the outcomes. Instead of splitting a single bullet at the source, we assume the bullet should hit two or more targets simultaneously. Pardon my vague example, but I guess you get the difference in methodological styles here. Note that even in frequentist methods, one can develop mixture models or use other latent modeling techniques to fit linear models, but my focus was in understanding the application of multivariate multiple regression and its coefficients.
A very good source for beginners to understand multivariate regression is the UCLA statistical teaching webpage. The author uses STATA to model a hypothetical dataset with 600 observations on seven variables. The psychological variables - locus of control, self-concept , and motivation are the outcome or dependent variables (DV). Whereas, the academic variables standardized tests scores in reading, writing , and science, type of program the student is in (general, academic, or vocational) are the inputs or independent variables (IV) in the model.
The author explains that multivariate regression allow us for testing of coefficents across equations. The coefficients as well as standard errors of the multivariate multiple regression are the same as ones for the corresponding univariate multiple regression models of the three outcomes. The author explains three applications for multivariate regression:
1) Simultanesous testing of significance of coefficients of each IV to DVs 2) Testing if coefficients for an IV is statistically different across DVs 3) Testing of differcence in coefficients values of multiple IVs across DVs
The Multivariate Analysis of variance (MANOVA) is a subset of Multivariate multiple regression method, such that it has only categorical variables as IVs. Moreoever, the objective of MANOVA, similar to ANOVA is to test if two or more (experimental) groups are statistically different for outcome variable(s). The sum of squares, the F-statistic and the p-value can be used to determine this, and group means can further be plotted with Confidence intervals after running a MANOVA.
The webpage talks of some added examples over univariate regression. I was not completely sure that I understood the primary application of multivariate multiple regression, as when to apply multivariate models in place of a series of univariate models from a perspective of methodological fit. If correlation between outcomes are not accounted for, how does the model fit differ? If it doesn’t and if one is not interested in inspecting the difference between coefficients of the multivariate regression model coefficients across outcomes, should one give up modeling the outcomes as multivariate? Taking a peak at the Bayesian multi-task learning perspective, I felt that there was more to simultaneous modeling of outcomes.
In the stackexchange discussion, some great opinions were shared about why multivariate analysis (such as MANOVA or repeated measures ANOVA) is more appropriate than univariate analysis, but the answer to the question is still not clear to a layman and an analyst interested in applying the multivariate multiple regression modeling technique. There are grey areas where most people end up reducing the dimensions of the outcome or use other methods such as canonical correlation analysis (a method that is agnostic of the IV and DV distinction), but the application of multivariate regression still seems unclear in most practical problems of today. No wonder we do not have web blogs talking about method improvements such as regularizations or generalized modeling for multivariate regression case.
Looks like the Bayesian approach is a safer alternative to tackle multiple outcomes for now.
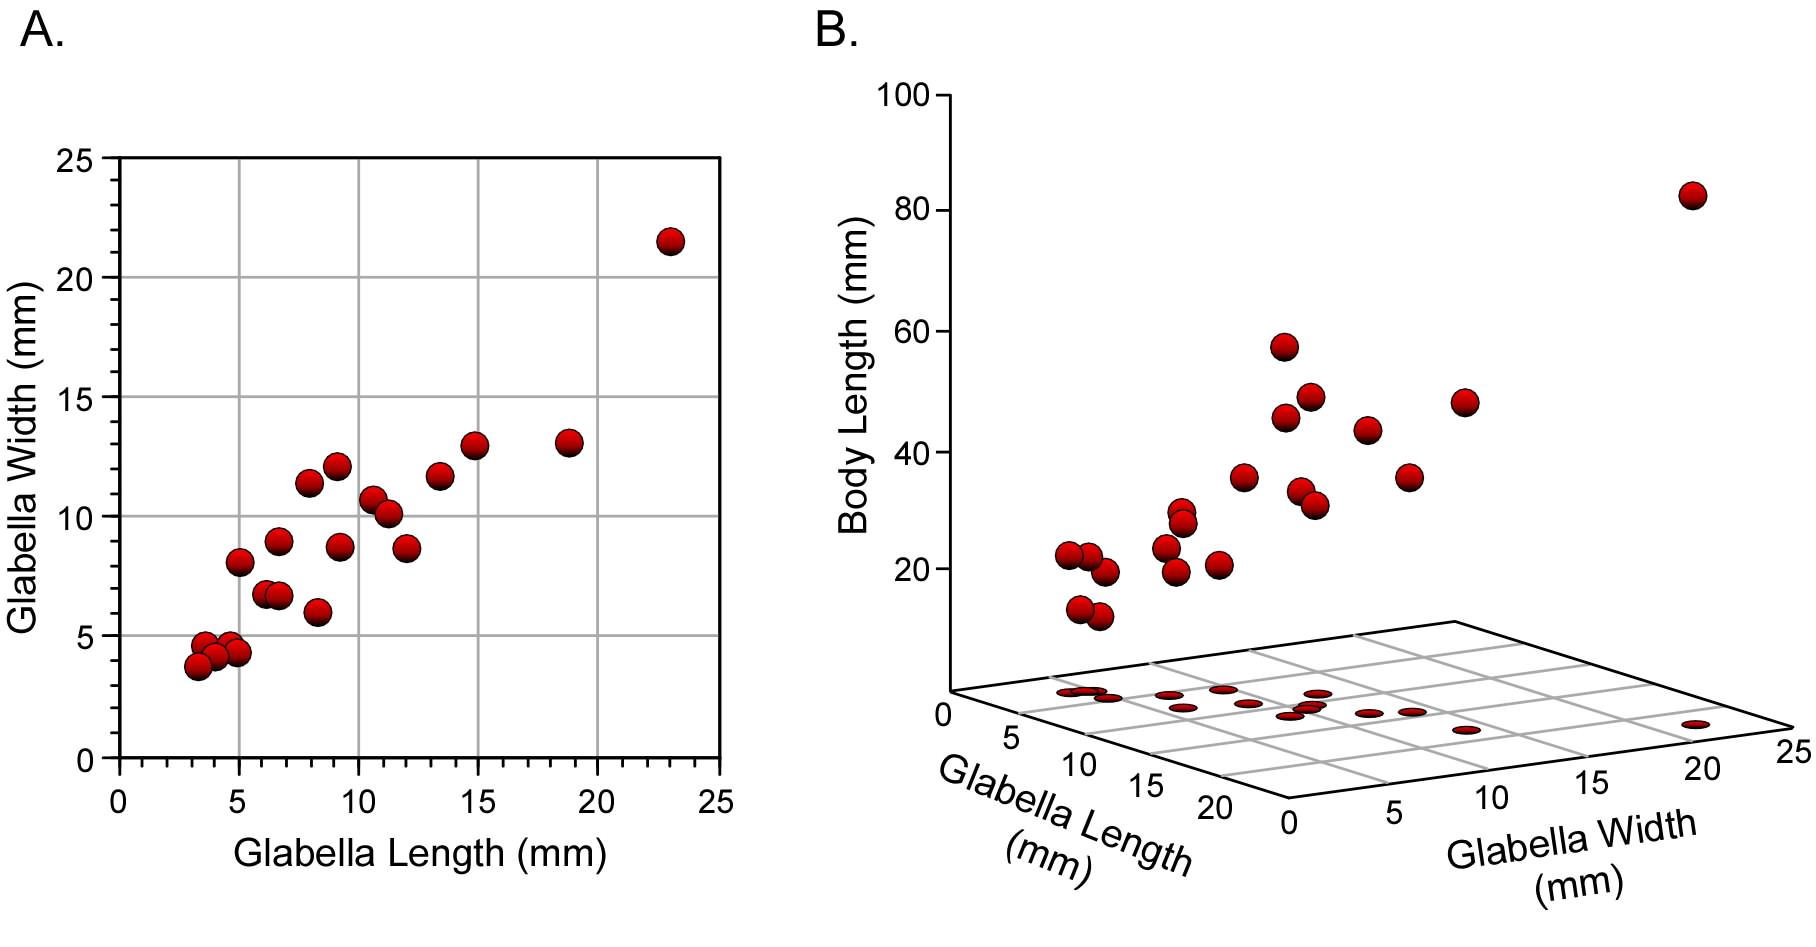
An example of two outcome variables and one input variable visualized in a 3-D scatter plot
Image source: https://www.palass.org/publications/newsletter/palaeomath-101/palaeomath-part-4-regression-iv
Additional useful reading references in this topic:
Multiple versus multivariate regression in plain words: https://stats.stackexchange.com/questions/2358/explain-the-difference-between-multiple-regression-and-multivariate-regression
Using R to do a regression with multiple dependent and multiple independent variables: https://stackoverflow.com/questions/18067519/using-r-to-do-a-regression-with-multiple-dependent-and-multiple-independent-vari
Multivariate regression - http://www.public.iastate.edu/~maitra/stat501/lectures/MultivariateRegression.pdf
How to read the output of MANOVA - https://stats.stackexchange.com/questions/215155/how-to-read-the-output-from-manova
Fitting MANOVA and summary(lm) for each outcome in R: http://www.public.iastate.edu/~maitra/stat501/Rcode/manova.R
Some ongoing discussions in stackexchange:
Linear multivariate regression in R - https://stackoverflow.com/questions/30976841/linear-multivariate-regression-in-r
How to write R formula for multivariate response? - https://stackoverflow.com/questions/12161659/how-to-write-r-formula-for-multivariate-response?answertab=oldest#tab-top
Why do we need multivariate regression (as opposed to a bunch of univariate regressions)? https://stats.stackexchange.com/questions/254254/why-do-we-need-multivariate-regression-as-opposed-to-a-bunch-of-univariate-regr
Linear multivariate regression in R https://stackoverflow.com/questions/30976841/linear-multivariate-regression-in-r